By Zevan | March 23, 2009
Actionscript:
-
[SWF(width=800, height=600)]
-
-
var canvas:Graphics;
-
var graphData:Array = sineData();
-
-
var graph0:Shape = Shape(addChild(new Shape()));
-
graph0.x = 50;
-
graph0.y = 150;
-
-
var graph1:Shape = Shape(addChild(new Shape()));
-
graph1.x = 400;
-
graph1.y = 150;
-
-
var graph2:Shape = Shape(addChild(new Shape()));
-
graph2.x = 50;
-
graph2.y = 400;
-
-
// use graphData to draw 3 different looking graphs:
-
-
canvas = graph0.graphics;
-
axis(lines(graphData));
-
-
canvas = graph1.graphics;
-
axis(dots(graphData, 0xFF0000), 0xFFCC00, 2);
-
-
canvas = graph2.graphics;
-
axis(dots(dots(lines(lines(graphData, 0xCCCCCC, 20))), 0x0022FF, 0, 4), 0xFF);
-
-
-
// generate data
-
function sineData():Array{
-
var dat:Array = new Array();
-
for (var i:int = 0; i<60; i++){
-
dat.push(new Point(i * 4, (30 + i) * Math.sin(i * 24 * Math.PI/180)));
-
}
-
return dat;
-
}
-
-
// render lines
-
function lines(dat:Array, col:uint=0x000000, thick:Number=0):Array{
-
canvas.lineStyle(thick, col);
-
canvas.moveTo(dat[0].x, dat[0].y)
-
for (var i:int = 1; i<dat.length; i++){
-
canvas.lineTo(dat[i].x, dat[i].y);
-
}
-
return dat;
-
}
-
-
// render dots
-
function dots(dat:Array, col:uint=0xFF0000, thick:Number=0, rad:Number=1.5):Array{
-
canvas.lineStyle(thick, col);
-
for (var i:int = 0; i<dat.length; i++){
-
canvas.drawCircle(dat[i].x, dat[i].y, rad);
-
}
-
return dat;
-
}
-
-
// render graph axis
-
function axis(dat:Array, col:uint=0x000000, thick:Number=0):Array{
-
var d:Array = dat.concat();
-
d.sortOn("y", Array.NUMERIC);
-
var lastIndex:int = d.length - 1;
-
var minY:Number = d[0].y;
-
var maxY:Number = d[lastIndex].y;
-
d.sortOn("x", Array.NUMERIC);
-
var minX:Number = d[0].x;
-
var maxX:Number = d[lastIndex].x;
-
canvas.lineStyle(thick, col, .2);
-
canvas.moveTo(minX, 0);
-
canvas.lineTo(maxX, 0);
-
canvas.lineStyle(thick, col);
-
canvas.moveTo(minX, minY);
-
canvas.lineTo(minX, maxY);
-
canvas.lineTo(maxX, maxY);
-
return dat;
-
}
This is something I've been meaning to post for awhile. Finally had time to write it today... It contains functions that are designed to be nested for the purpose of rendering a small data set in a few different ways...
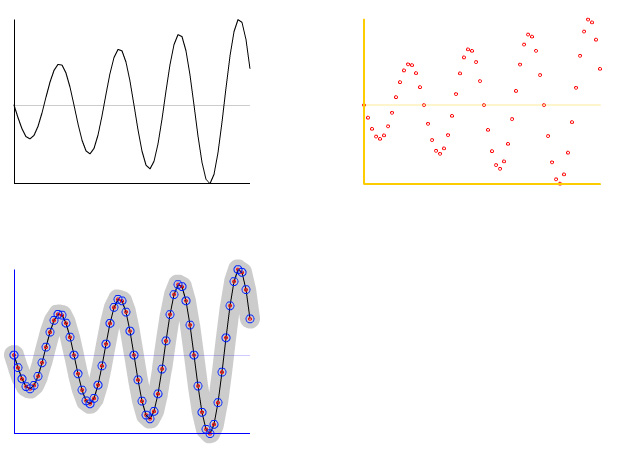
The upper left image is rendered with axis labels and lines... and it defaults to the color black (line 21):
axis(lines(graphData));
The upper right image is rendered with yellow axis and red dots (line 24):
axis(dots(graphData, 0xFF0000), 0xFFCC00, 2);
etc... (line 27)
axis(dots(dots(lines(lines(graphData, 0xCCCCCC, 20))), 0x0022FF, 0, 4), 0xFF);
Alternatively you could write each function call on one line:
lines(graphData, 0xCCCCCC, 20);

lines(graphData);

dots(graphData);

dots(graphData, 0x0022FF, 0, 4)

axis(graphData, 0xFF);
NOTE: If you think this post is insane, please read the warning page of this site...
By Zevan | March 22, 2009
Actionscript:
-
stage.frameRate = 30;
-
const TWO_PI:Number = Math.PI * 2;
-
var centerX:Number = 200;
-
var centerY:Number = 200;
-
var p:Array = new Array();
-
var zpos:Number;
-
var xpos:Number;
-
var ypos:Number;
-
var depth:Number;
-
var canvas:BitmapData = new BitmapData(400,400,true,0xFF000000);
-
addChild(new Bitmap(canvas));
-
-
var dy:Number = 0
-
var dx:Number = 0;
-
-
addEventListener(Event.ENTER_FRAME, onLoop);
-
function onLoop(evt:Event):void {
-
canvas.fillRect(canvas.rect, 0xFF000000);
-
-
dx += (mouseX / 100 - dx)/12;
-
dy += (mouseY / 100 - dy)/12;
-
var xp:Number, yp:Number, zp:Number;
-
-
canvas.lock();
-
for (var a:Number =0; a <TWO_PI; a+=.08){
-
for (var b:Number =0; b <TWO_PI; b+=.08){
-
xp = (70 + 40 * Math.cos(a)) * Math.cos(b) ;
-
yp = (70 + 40 * Math.cos(a)) * Math.sin(b);
-
zp = 40 * Math.sin(a);
-
calc3D(xp, yp, zp, dx, dy);
-
convert3D();
-
canvas.setPixel(p[0], p[1], 0xFFFFFF);
-
}
-
}
-
canvas.unlock();
-
}
-
function calc3D(px:Number, py:Number, pz:Number, rotX:Number=0, rotY:Number=0):void {
-
// I first learned this from code by Andries Odendaal - www.wireframe.co.za
-
zpos=pz*Math.cos(rotX)-px*Math.sin(rotX) ;
-
xpos=pz*Math.sin(rotX)+px*Math.cos(rotX) ;
-
ypos=py*Math.cos(rotY)-zpos*Math.sin(rotY) ;
-
zpos=py*Math.sin(rotY)+zpos*Math.cos(rotY);
-
}
-
function convert3D():void {
-
depth = 1/((zpos/200)+1);
-
p[0] = xpos * depth + centerX;
-
p[1] = ypos * depth + centerY;
-
}
This code draws a rotating 3D torus using setPixel().
By Zevan | March 22, 2009
Actionscript:
-
// variable is passed into the swf via Javascript (most likely swfObject)
-
// myswf.swf?myFlashVar="a new value"
-
-
var myFlashVar:String = "Some Default Value";
-
if (root.loaderInfo.parameters.myFlashVar){
-
myFlashVar = root.loaderInfo.parameters.myFlashVar;
-
}
Getting at flashvars in AS3 requires a bit more typing than it did in AS2. Above is a technique I find myself using from time to time. Usually for paths to xml or dynamic callouts (large buttons with text, an image and a link that change frequently).
By Zevan | March 21, 2009
Actionscript:
-
var t:Number=0, cos:Number, sin:Number;
-
-
var canvas:BitmapData = new BitmapData(400,400,false, 0x000000);
-
addChild(new Bitmap(canvas));
-
-
var shape:Shape = new Shape();
-
with(shape.graphics) beginFill(0x568338, .2), drawCircle(0,0,10);
-
-
addEventListener(Event.ENTER_FRAME, onLoop);
-
function onLoop(evt:Event):void {
-
-
t += .1;
-
// -- low precision sine/cosine
-
//always wrap input angle to -PI..PI
-
if (t <-3.14159265){
-
t += 6.28318531;
-
}else{
-
if (t> 3.14159265)
-
t -= 6.28318531;
-
}
-
-
//compute sine
-
if (t <0){
-
sin = 1.27323954 * t + .405284735 * t * t;
-
}else{
-
sin = 1.27323954 * t - 0.405284735 * t * t;
-
}
-
-
//compute cosine: sin(t + PI/2) = cos(t)
-
t += 1.57079632;
-
if (t> 3.14159265){
-
t -= 6.28318531;
-
}
-
-
if (t <0){
-
cos = 1.27323954 * t + 0.405284735 * t * t
-
}else{
-
cos = 1.27323954 * t - 0.405284735 * t * t;
-
}
-
t -= 1.57079632;
-
-
// move the shape
-
shape.x = 200 + 100 * cos;
-
shape.y = 200 + 100 * sin;
-
-
// draw to the canvas
-
canvas.draw(shape, shape.transform.matrix);
-
}
This snippet draws a circle using low precision sine and cosine... you'll notice that its not a perfect looking circle:
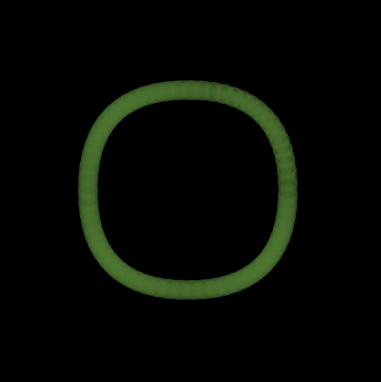
Back in January I saw this blog post by Michael Baczynski over at http://lab.polygonal.de/. The blog post describes a technique for fast sine and cosine approximation - (I highly recommend giving it a read - very fun stuff).
It's worth noting that there is a higher precision sine and cosine that will likely draw a better looking circle but will be about half as fast. According to the original post ... the low precision technique is approximately 14x faster than using Math.cos()/Math.sin().
There some other really great posts over at polygonal go check them out.
Posted in Math, motion | Tagged actionscrpt, flash |