-
[SWF(width=800, height=600)]
-
-
var canvas:Graphics;
-
var graphData:Array = sineData();
-
-
var graph0:Shape = Shape(addChild(new Shape()));
-
graph0.x = 50;
-
graph0.y = 150;
-
-
var graph1:Shape = Shape(addChild(new Shape()));
-
graph1.x = 400;
-
graph1.y = 150;
-
-
var graph2:Shape = Shape(addChild(new Shape()));
-
graph2.x = 50;
-
graph2.y = 400;
-
-
// use graphData to draw 3 different looking graphs:
-
-
canvas = graph0.graphics;
-
axis(lines(graphData));
-
-
canvas = graph1.graphics;
-
axis(dots(graphData, 0xFF0000), 0xFFCC00, 2);
-
-
canvas = graph2.graphics;
-
axis(dots(dots(lines(lines(graphData, 0xCCCCCC, 20))), 0x0022FF, 0, 4), 0xFF);
-
-
-
// generate data
-
function sineData():Array{
-
var dat:Array = new Array();
-
for (var i:int = 0; i<60; i++){
-
dat.push(new Point(i * 4, (30 + i) * Math.sin(i * 24 * Math.PI/180)));
-
}
-
return dat;
-
}
-
-
// render lines
-
function lines(dat:Array, col:uint=0x000000, thick:Number=0):Array{
-
canvas.lineStyle(thick, col);
-
canvas.moveTo(dat[0].x, dat[0].y)
-
for (var i:int = 1; i<dat.length; i++){
-
canvas.lineTo(dat[i].x, dat[i].y);
-
}
-
return dat;
-
}
-
-
// render dots
-
function dots(dat:Array, col:uint=0xFF0000, thick:Number=0, rad:Number=1.5):Array{
-
canvas.lineStyle(thick, col);
-
for (var i:int = 0; i<dat.length; i++){
-
canvas.drawCircle(dat[i].x, dat[i].y, rad);
-
}
-
return dat;
-
}
-
-
// render graph axis
-
function axis(dat:Array, col:uint=0x000000, thick:Number=0):Array{
-
var d:Array = dat.concat();
-
d.sortOn("y", Array.NUMERIC);
-
var lastIndex:int = d.length - 1;
-
var minY:Number = d[0].y;
-
var maxY:Number = d[lastIndex].y;
-
d.sortOn("x", Array.NUMERIC);
-
var minX:Number = d[0].x;
-
var maxX:Number = d[lastIndex].x;
-
canvas.lineStyle(thick, col, .2);
-
canvas.moveTo(minX, 0);
-
canvas.lineTo(maxX, 0);
-
canvas.lineStyle(thick, col);
-
canvas.moveTo(minX, minY);
-
canvas.lineTo(minX, maxY);
-
canvas.lineTo(maxX, maxY);
-
return dat;
-
}
This is something I've been meaning to post for awhile. Finally had time to write it today... It contains functions that are designed to be nested for the purpose of rendering a small data set in a few different ways...
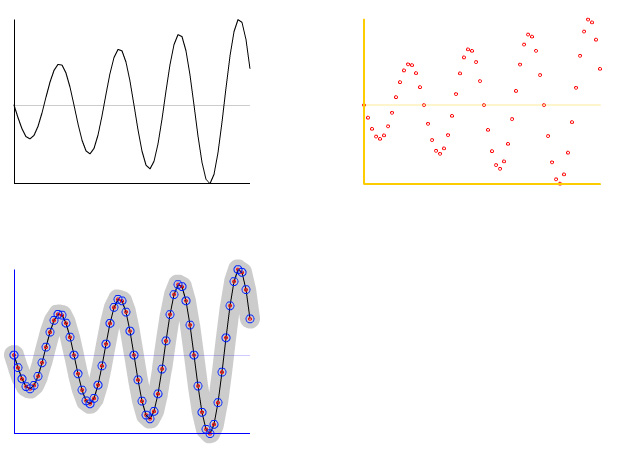
The upper left image is rendered with axis labels and lines... and it defaults to the color black (line 21):
axis(lines(graphData));
The upper right image is rendered with yellow axis and red dots (line 24):
axis(dots(graphData, 0xFF0000), 0xFFCC00, 2);
etc... (line 27)
axis(dots(dots(lines(lines(graphData, 0xCCCCCC, 20))), 0x0022FF, 0, 4), 0xFF);
Alternatively you could write each function call on one line:
lines(graphData, 0xCCCCCC, 20);

lines(graphData);

dots(graphData);

dots(graphData, 0x0022FF, 0, 4)

axis(graphData, 0xFF);
NOTE: If you think this post is insane, please read the warning page of this site...