By Zevan | March 26, 2009
Just wanted to post a link to Joa Ebert’s ActionScript Wiki. Looks like there’s some great stuff there…
Posted in misc | Also tagged flash |
By Zevan | March 25, 2009
Actionscript:
-
var canvas:BitmapData = new BitmapData(400,400,false, 0x000000);
-
addChild(new Bitmap(canvas));
-
-
var p0:Sprite = dot(100, 100);
-
var p1:Sprite = dot(120, 180);
-
var p2:Sprite = dot(220, 180);
-
var p3:Sprite = dot(250, 250);
-
-
addEventListener(Event.ENTER_FRAME, onLoop);
-
function onLoop(evt:Event):void {
-
canvas.lock();
-
canvas.fillRect(canvas.rect, 0x000000);
-
-
curve(p0, p1, p2, p3);
-
canvas.unlock();
-
}
-
-
-
// all math from http://en.wikipedia.org/wiki/Cubic_Hermite_spline
-
function curve(p0:Sprite, p1:Sprite, p2:Sprite, p3:Sprite, rez:Number=.02):void{
-
var px:Number = 0;
-
var py:Number = 0;
-
var m0:Point = tangent(p1, p0);
-
var m1:Point = tangent(p2, p0);
-
var m2:Point = tangent(p3, p1);
-
var m3:Point = tangent(p3, p2);
-
-
for (var t:Number = 0; t <1; t+=rez){
-
var t_2:Number = t * t;
-
var _1_t:Number = 1 - t;
-
var _2t:Number = 2 * t;
-
-
var h00:Number = (1 + _2t) * (_1_t) * (_1_t);
-
var h10:Number = t * (_1_t) * (_1_t);
-
var h01:Number = t_2 * (3 - _2t);
-
var h11:Number = t_2 * (t - 1);
-
-
px = h00 * p0.x + h10 * m0.x + h01 * p1.x + h11 * m1.x;
-
py = h00 * p0.y + h10 * m0.y + h01 * p1.y + h11 * m1.y;
-
canvas.setPixel(px, py, 0xFFFFFF);
-
-
px = h00 * p1.x + h10 * m1.x + h01 * p2.x + h11 * m2.x;
-
py = h00 * p1.y + h10 * m1.y + h01 * p2.y + h11 * m2.y;
-
canvas.setPixel(px, py, 0xFFFFFF);
-
-
px = h00 * p2.x + h10 * m2.x + h01 * p3.x + h11 * m3.x;
-
py = h00 * p2.y + h10 * m2.y + h01 * p3.y + h11 * m3.y;
-
canvas.setPixel(px, py, 0xFFFFFF);
-
}
-
}
-
-
function tangent(pk1:Sprite, pk_1:Sprite){
-
return new Point((pk1.x - pk_1.x) / 2, (pk1.y - pk_1.y) / 2);
-
}
-
-
// draggable dot
-
function dot(xp:Number, yp:Number, col:uint = 0x507399, rad:Number=5):Sprite {
-
var s:Sprite = Sprite(addChild(new Sprite));
-
s.x = xp;
-
s.y = yp;
-
with(s.graphics) beginFill(col), drawCircle(0,0,rad);
-
s.buttonMode = true;
-
s.addEventListener(MouseEvent.MOUSE_DOWN, onDrag);
-
return s;
-
}
-
function onDrag(evt:MouseEvent):void {
-
evt.currentTarget.startDrag()
-
}
-
stage.addEventListener(MouseEvent.MOUSE_UP, onUp);
-
function onUp(evt:MouseEvent):void{
-
stopDrag();
-
}
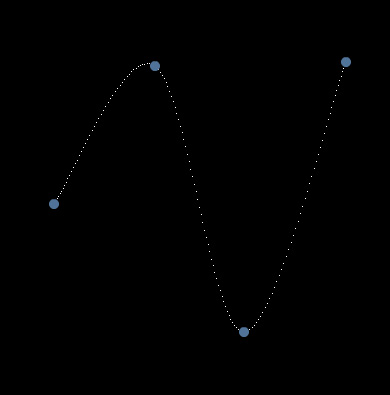
This is snippet draws a Catmull-Rom spline based on 4 control points. A nice feature of Catmull-Rom splines is that they always pass through each of their control points.
have a look at the swf here:
I first learned about Catmull-Rom splines somewhere in the processing forums.
I got all my info for this snippet from this wikipedia page.
There is a good deal of room for optimization here... I may post an optimized version in the future.
By Zevan | March 24, 2009
Actionscript:
-
var canvas:BitmapData = new BitmapData(400,400,false, 0x000000);
-
addChild(new Bitmap(canvas));
-
-
// create some draggable dots
-
var p0:Sprite = dot(100, 100);
-
var p1:Sprite = dot(200, 200);
-
var m0:Sprite = dot(200, 100, 0xFFFFFF, 3)
-
var m1:Sprite = dot(100, 200, 0xFFFFFF, 3);
-
-
addEventListener(Event.ENTER_FRAME, onLoop);
-
function onLoop(evt:Event):void {
-
canvas.fillRect(canvas.rect, 0x000000);
-
var px:Number = 0;
-
var py:Number = 0;
-
for (var t:Number = 0; t <1; t+=.01){
-
var t_2:Number = t * t;
-
var t_3:Number = t_2 * t;
-
-
// some repetitive math for clarity
-
px = (2 * t_3 - 3 * t_2 + 1) * p0.x +(t_3 - 2 * t_2 + t) *
-
m0.x + (-2 * t_3 + 3 * t_2) * p1.x + (t_3 - t_2) * m1.x;
-
py = (2 * t_3 - 3 * t_2 + 1) * p0.y +(t_3 - 2 * t_2 + t) *
-
m0.y + (-2 * t_3 + 3 * t_2) * p1.y + (t_3 - t_2) * m1.y;
-
canvas.setPixel(px, py, 0xFF0000);
-
}
-
}
-
// draggable dot
-
function dot(xp:Number, yp:Number, col:uint = 0x507399, rad:Number=5):Sprite {
-
var s:Sprite = Sprite(addChild(new Sprite()));
-
s.x = xp;
-
s.y = yp;
-
with(s.graphics) beginFill(col), drawCircle(0,0,rad);
-
s.buttonMode = true;
-
s.addEventListener(MouseEvent.MOUSE_DOWN, onDrag);
-
return s;
-
}
-
function onDrag(evt:MouseEvent):void {
-
evt.currentTarget.startDrag()
-
}
-
stage.addEventListener(MouseEvent.MOUSE_UP, onUp);
-
function onUp(evt:MouseEvent):void{
-
stopDrag();
-
}
This is the start of my exploration of Cubic Hermite Splines (like Catmull–Rom)... I wrote this snippet while skimming the wikipedia article on the subject.... at first I wasn't sure if this was correct, but I added tangent calculations for a Catmull-Rom and it worked nicely... will post that tomorrow.
By Zevan | March 23, 2009
Actionscript:
-
[SWF(width=800, height=600)]
-
-
var canvas:Graphics;
-
var graphData:Array = sineData();
-
-
var graph0:Shape = Shape(addChild(new Shape()));
-
graph0.x = 50;
-
graph0.y = 150;
-
-
var graph1:Shape = Shape(addChild(new Shape()));
-
graph1.x = 400;
-
graph1.y = 150;
-
-
var graph2:Shape = Shape(addChild(new Shape()));
-
graph2.x = 50;
-
graph2.y = 400;
-
-
// use graphData to draw 3 different looking graphs:
-
-
canvas = graph0.graphics;
-
axis(lines(graphData));
-
-
canvas = graph1.graphics;
-
axis(dots(graphData, 0xFF0000), 0xFFCC00, 2);
-
-
canvas = graph2.graphics;
-
axis(dots(dots(lines(lines(graphData, 0xCCCCCC, 20))), 0x0022FF, 0, 4), 0xFF);
-
-
-
// generate data
-
function sineData():Array{
-
var dat:Array = new Array();
-
for (var i:int = 0; i<60; i++){
-
dat.push(new Point(i * 4, (30 + i) * Math.sin(i * 24 * Math.PI/180)));
-
}
-
return dat;
-
}
-
-
// render lines
-
function lines(dat:Array, col:uint=0x000000, thick:Number=0):Array{
-
canvas.lineStyle(thick, col);
-
canvas.moveTo(dat[0].x, dat[0].y)
-
for (var i:int = 1; i<dat.length; i++){
-
canvas.lineTo(dat[i].x, dat[i].y);
-
}
-
return dat;
-
}
-
-
// render dots
-
function dots(dat:Array, col:uint=0xFF0000, thick:Number=0, rad:Number=1.5):Array{
-
canvas.lineStyle(thick, col);
-
for (var i:int = 0; i<dat.length; i++){
-
canvas.drawCircle(dat[i].x, dat[i].y, rad);
-
}
-
return dat;
-
}
-
-
// render graph axis
-
function axis(dat:Array, col:uint=0x000000, thick:Number=0):Array{
-
var d:Array = dat.concat();
-
d.sortOn("y", Array.NUMERIC);
-
var lastIndex:int = d.length - 1;
-
var minY:Number = d[0].y;
-
var maxY:Number = d[lastIndex].y;
-
d.sortOn("x", Array.NUMERIC);
-
var minX:Number = d[0].x;
-
var maxX:Number = d[lastIndex].x;
-
canvas.lineStyle(thick, col, .2);
-
canvas.moveTo(minX, 0);
-
canvas.lineTo(maxX, 0);
-
canvas.lineStyle(thick, col);
-
canvas.moveTo(minX, minY);
-
canvas.lineTo(minX, maxY);
-
canvas.lineTo(maxX, maxY);
-
return dat;
-
}
This is something I've been meaning to post for awhile. Finally had time to write it today... It contains functions that are designed to be nested for the purpose of rendering a small data set in a few different ways...
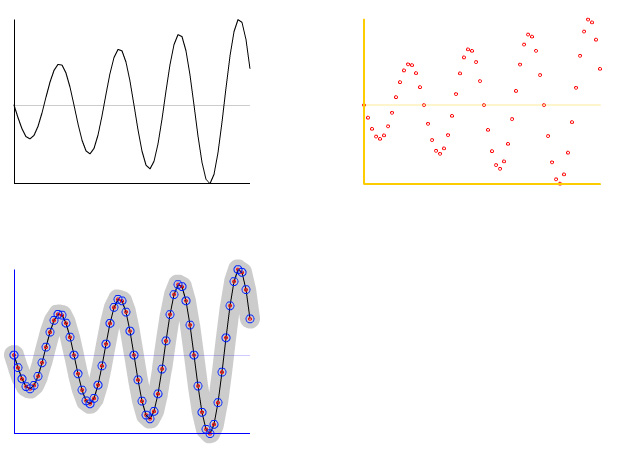
The upper left image is rendered with axis labels and lines... and it defaults to the color black (line 21):
axis(lines(graphData));
The upper right image is rendered with yellow axis and red dots (line 24):
axis(dots(graphData, 0xFF0000), 0xFFCC00, 2);
etc... (line 27)
axis(dots(dots(lines(lines(graphData, 0xCCCCCC, 20))), 0x0022FF, 0, 4), 0xFF);
Alternatively you could write each function call on one line:
lines(graphData, 0xCCCCCC, 20);

lines(graphData);

dots(graphData);

dots(graphData, 0x0022FF, 0, 4)

axis(graphData, 0xFF);
NOTE: If you think this post is insane, please read the warning page of this site...
Posted in Graphics, functions, misc | Also tagged flash |