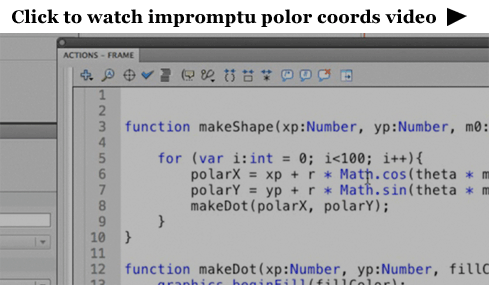
If you're at all interested in watching me free from code. I recorded a video of me coding this snippet (which is about 11 minutes long or so).
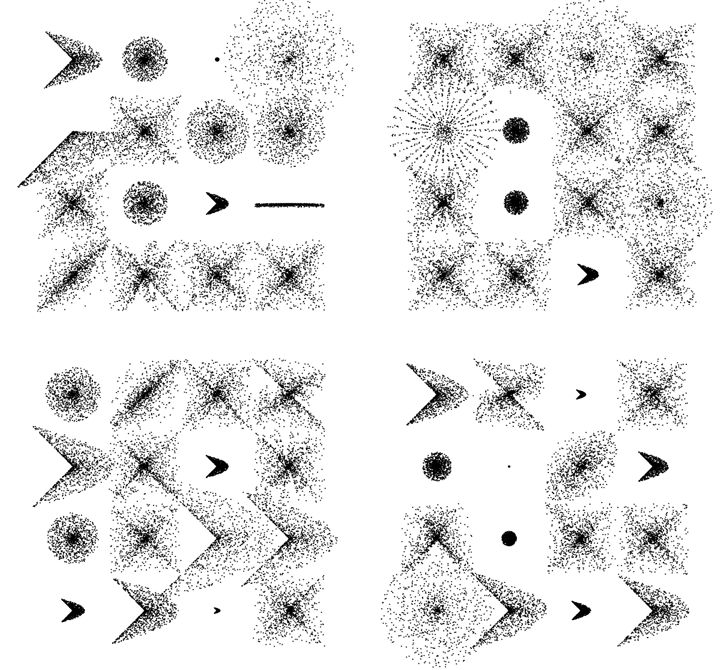
In the video I create a few functions that allow you to draw shapes like these:

Mathematically this stuff is really simple ... the free form nature of the video takes a less technical perspective as you'll see (I even made a few funny mistakes).

Actionscript:
-
[SWF(width = 600, height = 600)]
-
var dotNum:int = 1000;
-
var dotRad:Number = 0.5;
-
-
x = 120
-
y = 100;
-
-
// extra stuff to display what the functions can do
-
stage.addEventListener(MouseEvent.CLICK, onDrawAll);
-
-
function onDrawAll(evt:Event):void{
-
graphics.clear();
-
for (var i:int = 0; i<16; i++){
-
var m:Number;
-
-
var rad:Number = 120;
-
var xp:Number = i % 4 * rad
-
var yp:Number = int(i / 4) * rad
-
-
var type:int = int(Math.random() * 4);
-
if (type == 0){
-
makeShape(xp, yp, rad-60, Math.random() , 1);
-
}else if (type == 1){
-
makeShape(xp, yp, rad-60, 1, Math.random());
-
}
-
else if (type == 2){
-
m = Math.random() * 2;
-
makeShape(xp, yp, rad-Math.random()*120, m, m);
-
}
-
else if (type == 3){
-
m = Math.random() * 2;
-
makeShape(xp, yp, rad-Math.random()*120, m, m/2);
-
}
-
}
-
}
-
-
// main part from the video
-
function makeShape(xp:Number, yp:Number,
-
maxRad:Number = 100,m0:Number=1,
-
m1:Number=1):void{
-
var polarX:Number;
-
var polarY:Number;
-
var radius:Number;
-
graphics.lineStyle(0, 0);
-
var theta:Number = Math.random() * Math.PI * 2;
-
for (var i:int = 0; i<dotNum; i++){
-
radius = Math.random() * maxRad
-
polarX = xp + radius * Math.cos(theta * m0);
-
polarY = yp + radius * Math.sin(theta * m1);
-
theta += 0.1;
-
-
makeDot(polarX, polarY);
-
-
}
-
}
-
-
function makeDot(xp:Number, yp:Number, fillColor:uint = 0x000000):void{
-
graphics.beginFill(fillColor);
-
graphics.drawCircle(xp, yp, dotRad);
-
graphics.endFill();
-
}
Here it is over at wonderf:
By Zevan | February 23, 2010
Some of you may have seen these preliminary test images images on my flickr:


If your up for it .... i am working on collecting colors and words for use with this project ... so watch the video (below) and go to the link (below) you will be able to make a contribution.
LEARN ABOUT THE TOOLS
video, (may not all make sense but the tool is shown which is the important part)
POPULATE THE DB
population tool add some colors
I have a smart filter that checks for people doing weird things like curses etc... so don't bother trying to do that.
Additional info here, scroll down to see our presentation about the project
Posted in misc | Tagged color occurence |
By Zevan | January 4, 2010
Actionscript:
-
[SWF (width = 500, height = 500)]
-
-
var canvas:BitmapData = new BitmapData(stage.stageWidth, stage.stageHeight, false, 0xFFFFFF);
-
addChild(new Bitmap(canvas));
-
-
var indexCanvas:BitmapData = new BitmapData(stage.stageWidth, stage.stageHeight, false, 0xFFFFFF);
-
-
var btnNum:int = 5000;
-
var info:Array = [];
-
-
var brush:BitmapData = new BitmapData(10,10,false, 0xCCCCCC);
-
var border:Shape = new Shape();
-
border.graphics.lineStyle(2, 0x000000);
-
border.graphics.drawRect(0,0,10,10);
-
brush.draw(border);
-
-
var txt:TextField = TextField(addChild(new TextField()));
-
with (txt) height = 20, width = 50, background = 0xFFFFFF, selectable = false
-
var tf:TextFormat = new TextFormat();
-
tf.align = TextFormatAlign.RIGHT;
-
txt.border= true;
-
txt.defaultTextFormat = tf;
-
-
var redRect:Shape = Shape(addChild(new Shape()));
-
with (redRect.graphics) beginFill(0xFF0000), drawRect(0,0,10,10);
-
-
var pnt:Point = new Point();
-
var r:Rectangle = new Rectangle(0,0,10,10);
-
for (var i:int = 0; i <btnNum; i++){
-
pnt.x = r.x = int(Math.random() * stage.stageWidth);
-
pnt.y = r.y = int(Math.random() * stage.stageHeight);
-
indexCanvas.fillRect(r, i);
-
canvas.copyPixels(brush, brush.rect, pnt)
-
info[i] = [r.x, r.y, i];
-
}
-
-
addEventListener(Event.ENTER_FRAME, onCheckBtns);
-
function onCheckBtns(evt:Event):void{
-
var currentIndex:int = indexCanvas.getPixel(mouseX, mouseY);
-
if (currentIndex != 0xFFFFFF){
-
var currentBox:Array = info[currentIndex]
-
redRect.visible = true;
-
redRect.x = currentBox[0];
-
txt.y = redRect.y = currentBox[1];
-
if (mouseX <txt.width){
-
tf.align = TextFormatAlign.LEFT;
-
txt.defaultTextFormat = tf;
-
txt.x = redRect.x + 10;
-
}else{
-
tf.align = TextFormatAlign.RIGHT;
-
txt.defaultTextFormat = tf;
-
txt.x = redRect.x - txt.width;
-
}
-
txt.text = currentBox[2];
-
txt.visible = true;
-
}else{
-
redRect.visible = false;
-
txt.visible = false;
-
}
-
}
This is a simplified example of the technique discussed in yesterdays post. The idea is to use a BitmapData image to store index values for a large number of elements that need to be able to act as if the have MouseEvents. For a more detailed description of this technique see yesterdays post.
Have a look at the swf on wonderfl
By Zevan | January 3, 2010
Actionscript:
-
[SWF(width = 500, height = 500, frameRate = 30)]
-
-
var canvas:BitmapData = new BitmapData(stage.stageWidth,stage.stageHeight,false, 0xFFFFFF);
-
-
var indexCanvas:BitmapData = new BitmapData(stage.stage.stageWidth, stage.stageHeight, false,
-
0xFFFFFF);
-
addChild(new Bitmap(canvas));
-
-
var s:Shape = new Shape();
-
-
var lineData:Array = [];
-
var dataIndex:int = 0;
-
-
trace(0xFFFFFF - 1)
-
var totalLines:int = 20000;
-
var iterations:int = 9;
-
var linesPerIter:int = totalLines / iterations;
-
-
var xp:int = stage.stageWidth / 2;
-
var yp:int = stage.stageHeight / 2;
-
-
var stepAmt:Number = 60;
-
var halfStepAmt:Number = stepAmt / 2;
-
-
addEventListener(Event.ENTER_FRAME, onDraw);
-
function onDraw(evt:Event):void {
-
if (lineData.length <totalLines){
-
generateData(linesPerIter);
-
}else{
-
stage.quality = "high";
-
addChild(s);
-
s.x = 0;
-
s.y = 0;
-
-
removeEventListener(Event.ENTER_FRAME, onDraw);
-
addEventListener(Event.ENTER_FRAME, onRun);
-
}
-
}
-
-
function onRun(evt:Event):void {
-
var currentIndex:int = indexCanvas.getPixel(mouseX, mouseY);
-
var currentLine:Array = lineData[currentIndex];
-
-
s.graphics.clear();
-
if (currentIndex != 0xFFFFFF){
-
s.graphics.lineStyle(3, 0xFF0000);
-
s.graphics.moveTo(currentLine[0], currentLine[1]);
-
s.graphics.lineTo(currentLine[2], currentLine[3]);
-
}
-
}
-
-
function generateData(num:int):void{
-
var rxA:int, rxB:int, ryA:int, ryB:int;
-
var g:Graphics = s.graphics;
-
for (var i:int = 0; i<num; i++){
-
rxA = xp;
-
ryA = yp;
-
-
xp += Math.round(Math.random() * stepAmt) - halfStepAmt;
-
yp += Math.round(Math.random() * stepAmt) - halfStepAmt;
-
-
if (xp> stage.stageWidth){
-
xp = stage.stageWidth - halfStepAmt;
-
}else
-
if (xp <0){
-
xp = halfStepAmt;
-
}
-
if (yp> stage.stageHeight){
-
yp = stage.stageHeight - halfStepAmt;
-
}else
-
if (yp <0){
-
yp = halfStepAmt;
-
}
-
-
rxB = xp;
-
ryB = yp;
-
-
lineData[dataIndex] = [rxA, ryA, rxB, ryB];
-
s.x = rxA;
-
s.y = ryA;
-
var endX:Number = rxB - rxA;
-
var endY:Number = ryB - ryA;
-
var m:Matrix = s.transform.matrix;
-
g.clear();
-
g.lineStyle(1, 0x000000, 0.3);
-
-
g.lineTo(endX, endY);
-
stage.quality = "high";
-
canvas.draw(s, m);
-
-
g.clear();
-
g.lineStyle(3, dataIndex);
-
-
g.lineTo(endX, endY);
-
stage.quality = "low";
-
indexCanvas.draw(s, m);
-
-
dataIndex++
-
}
-
}
I'm working on a data visualization that contains a long path made up of approximately one million points. There is some information associated with every two sets of coordinates that needs to be displayed when the user rolls their mouse over any part of the line.
I took a little time to think about the best way to do this and came up with a few techniques. The first one I tried seems to work nicely - this snippet is the proof of concept for that first technique. I tested this snippet with 1,000,000 xy coordinates and it works nicely. It takes a little while to draw though, so for the purposes of this demo I've just included 20,000 coordinates.
Have a look at the swf over at wonderfl.net
The way this works is by drawing lines to two different BitmapData instances. I draw anti-aliased slightly transparent lines to a BitmapData instance called "canvas" (this is added to the display list) - I then draw aliased lines to a BitmapData called "indexCanvas" (this is never added to the display list) - each aliased line uses an incremental value for its color - this incremental value is also the index for a two dimensional array containing the coordinate information for the aliased line. I use getPixel() on the "indexCanvas" and use the return value as the index for the 2D array. The data from the 2D array is used to draw a red line with the graphics class. This technique enables you to have many many rollovers and all you ever have to do is call getPixel() and use the returned color value to look up info about what you're mouse is touching.
There are a few cool ways this could be repurposed and this is really only one solution to the problem of having many many things that you need to be able to rollover... there are others that don't use BitmapData at all... I may write those up in the next couple of days.
Also posted in BitmapData, Data Structures, UI, arrays, display list, graphics algorithms, matrix, pixel manipulation, return values | Tagged actionscript, as3, flash |


