var offX:Number = 100;
var offY:Number = 300;
var scalarX:Number = 6;
var scalarY:Number = 200;
addEventListener(Event.ENTER_FRAME, onLoop);
function onLoop(evt:Event):void{
	var r:Number = mouseY / 100;
	var xn:Number = (mouseX - 100) / 650;
	var xn1:Number = 0;
	graphics.clear();
	graphics.lineStyle(0,0);
	for (var i:int = 0; i<100; i++){
	  xn1 = r * xn * (1 - xn);
	  xn = xn1;
	  if (i == 0){
		graphics.moveTo(offX+i*scalarX,offY+xn1*scalarY);
	  }else{
		graphics.lineTo(offX+i*scalarX, offY+xn1*scalarY);
	  }
	}
}
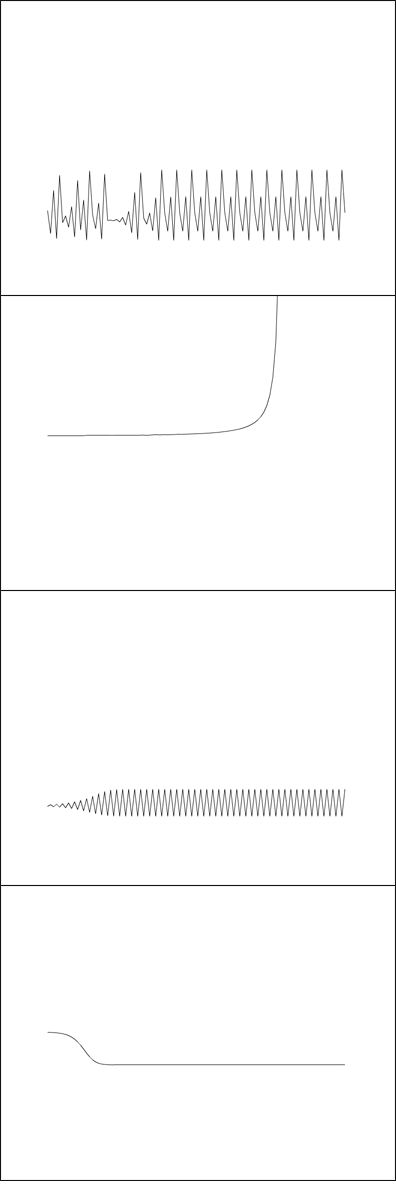
Whenever I can’t decide what kind of snippet to make, I simply go to wikipedia or mathworld for a bit and I always end up with something. I’ve messed with Logistic Maps before (when learning about strange attractors). This is a simple rendering where the x and y axis change the biotic potential (r) and the starting value for x.
Here is the link I used for reference.
Have a look at the swf (just move your mouse around).
Dude, someday you might freak out.. hehehe..
I’ve already freaked out a few times in my life because of this stuff so know what you mean.