Browse the notebook

Category: Graphics

Fermat’s Spiral

x = stage.stageWidth / 2;
y = stage.stageHeight / 2;

var xp:Number = 0, yp:Number = 0;
var r:Number = 0, t:Number = 0;
var speed:Number = .07;
var scale:Number = 20;

var plot0:Shape = Shape(addChild(new Shape()));
var plot1:Shape = Shape(addChild(new Shape()));
plot0.graphics.lineStyle(0,0x000000);
plot1.graphics.lineStyle(0,0x000000);

addEventListener(Event.ENTER_FRAME, onLoop);
function onLoop(evt:Event):void {
	 r =  scale * Math.sqrt(t);
	 xp =  r * Math.cos(t);
	 yp =  r * Math.sin(t);
	 t += speed;
	 
	plot0.graphics.lineTo(xp, yp);
    plot1.graphics.lineTo(-xp, -yp);
}

This snippet draws Fermat’s Spiral.

Read snippet: Fermat’s Spiral

more(nesting(functions(graphDrawing)));

[SWF(width=800, height=600)]

var canvas:Graphics; 
var graphData:Array = sineData();

var graph0:Shape = Shape(addChild(new Shape()));
graph0.x = 50;
graph0.y = 150;

var graph1:Shape = Shape(addChild(new Shape()));
graph1.x = 400;
graph1.y = 150;

var graph2:Shape = Shape(addChild(new Shape()));
graph2.x = 50;
graph2.y = 400;

// use graphData to draw 3 different looking graphs:

canvas = graph0.graphics;
axis(lines(graphData));

canvas = graph1.graphics;
axis(dots(graphData, 0xFF0000), 0xFFCC00, 2);

canvas = graph2.graphics;
axis(dots(dots(lines(lines(graphData, 0xCCCCCC, 20))), 0x0022FF, 0, 4), 0xFF);


// generate data
function sineData():Array{
	var dat:Array = new Array();
	for (var i:int = 0; i<60; i++){
		dat.push(new Point(i * 4,  (30 + i) * Math.sin(i * 24 * Math.PI/180)));
	}            
	return dat;
}

// render lines
function lines(dat:Array, col:uint=0x000000, thick:Number=0):Array{
	canvas.lineStyle(thick, col);
	canvas.moveTo(dat[0].x, dat[0].y)
	for (var i:int = 1; i<dat.length; i++){
		 canvas.lineTo(dat[i].x, dat[i].y);
	}
	return dat;
}

// render dots
function dots(dat:Array, col:uint=0xFF0000, thick:Number=0, rad:Number=1.5):Array{
	canvas.lineStyle(thick, col);
	for (var i:int = 0; i<dat.length; i++){
		 canvas.drawCircle(dat[i].x, dat[i].y, rad);
	}
	return dat;
}

// render graph axis
function axis(dat:Array, col:uint=0x000000, thick:Number=0):Array{
	var d:Array = dat.concat();
	d.sortOn("y", Array.NUMERIC);
	var lastIndex:int = d.length - 1;
	var minY:Number = d[0].y;
	var maxY:Number = d[lastIndex].y;
	d.sortOn("x", Array.NUMERIC);
	var minX:Number = d[0].x;
	var maxX:Number = d[lastIndex].x;
	canvas.lineStyle(thick, col, .2);
	canvas.moveTo(minX, 0);
	canvas.lineTo(maxX, 0);
	canvas.lineStyle(thick, col);
	canvas.moveTo(minX, minY);
	canvas.lineTo(minX, maxY);
	canvas.lineTo(maxX, maxY);
	return dat;
}

This is something I’ve been meaning to post for awhile. Finally had time to write it today… It contains functions that are designed to be nested for the purpose of rendering a small data set in a few different ways…
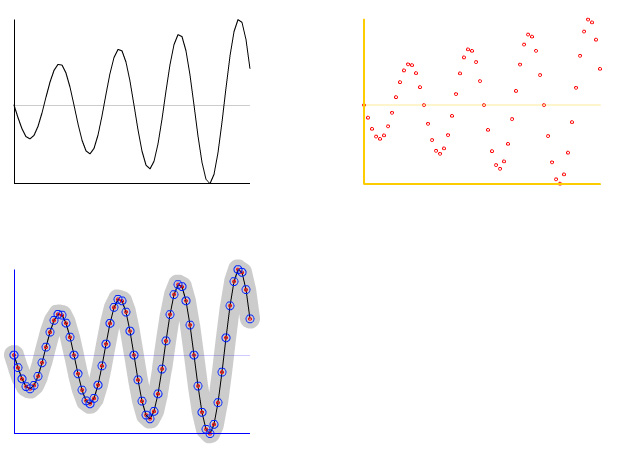
The upper left image is rendered with axis labels and lines… and it defaults to the color black (line 21):

axis(lines(graphData));

The upper right image is rendered with yellow axis and red dots (line 24):

axis(dots(graphData, 0xFF0000), 0xFFCC00, 2);

etc… (line 27)
axis(dots(dots(lines(lines(graphData, 0xCCCCCC, 20))), 0x0022FF, 0, 4), 0xFF);

Alternatively you could write each function call on one line:

lines(graphData, 0xCCCCCC, 20);
lines(graphData);
dots(graphData);
dots(graphData, 0x0022FF, 0, 4)
axis(graphData, 0xFF);

NOTE: If you think this post is insane, please read the warning page of this site…

Read snippet: more(nesting(functions(graphDrawing)));

Snap to Grid

[SWF(width = 600, height = 400)]

// draw the same grid as yesterday
var tileSize:int = 40;
var cols:int = stage.stageWidth / tileSize;
var rows:int = stage.stageHeight / tileSize;
var grid:Sprite = Sprite(addChild(new Sprite()));
grid.graphics.lineStyle(0,0x000000);
var i:int = 0;
for (i = 1; i<cols; i++){
	var posX:Number = i * tileSize
	grid.graphics.moveTo(posX, 0);
	grid.graphics.lineTo(posX, stage.stageHeight);
}
for (i = 1; i<rows; i++){
	var posY:Number = i * tileSize
	grid.graphics.moveTo(0, posY);
	grid.graphics.lineTo(stage.stageWidth, posY);
}

//
// -- add a circle that snaps to the grid when dragged
//
var circle:Sprite = Sprite(addChild(new Sprite()));
with (circle.graphics) beginFill(0xFF0000), drawCircle(0,0,10);
circle.x = circle.y =  tileSize * 3;
circle.buttonMode = true;

circle.addEventListener(MouseEvent.MOUSE_DOWN, onDown);
function onDown(evt:MouseEvent):void {
	addEventListener(Event.ENTER_FRAME, onRunSnapping);
}

function onRunSnapping(evt:Event):void {
	circle.x =  Math.round(mouseX / tileSize) * tileSize;
	circle.y =  Math.round(mouseY / tileSize) * tileSize;
}

stage.addEventListener(MouseEvent.MOUSE_UP, onUp);
function onUp(evt:MouseEvent):void {
	removeEventListener(Event.ENTER_FRAME, onRunSnapping);
}

This builds on yesterdays post by adding a draggable red circle that snaps to the grid. This is the real trick:

circle.x =  Math.round(mouseX / tileSize) * tileSize;
circle.y =  Math.round(mouseY / tileSize) * tileSize;
Read snippet: Snap to Grid

Stage Grid

// try changing the size of  the stage
[SWF(width = 600, height = 400)]

// try changing the tile size (make sure swf width and height are evenly divisible by this number)
var tileSize:int = 20;


var cols:int = stage.stageWidth / tileSize;
var rows:int = stage.stageHeight / tileSize;

var grid:Sprite = Sprite(addChild(new Sprite()));
grid.graphics.lineStyle(0,0x000000);

var i:int = 0;

for (i = 1; i<cols; i++){
	var posX:Number = i * tileSize
	grid.graphics.moveTo(posX, 0);
	grid.graphics.lineTo(posX, stage.stageHeight);
}
for (i = 1; i<rows; i++){
	var posY:Number = i * tileSize
	grid.graphics.moveTo(0, posY);
	grid.graphics.lineTo(stage.stageWidth, posY);
}

This is a quick way to fill the stage with a grid. I like my grids to have square tiles with sizes like 5×5, 10×10 20×20 etc…. So as long as you make sure that you’re swf width and height are evenly divisible by your tileSize, this snippet will work nicely.

Read snippet: Stage Grid

lineTo() w/ drawCircle()

var dial:Sprite = Sprite(addChild(new Sprite()));
with(dial.graphics) lineStyle(1, 0x000000), beginFill(0xCCCCCC), drawCircle(0,0,100), lineTo(0,0);
dial.x = stage.stageWidth / 2;
dial.y = stage.stageHeight / 2;

This snippet shows how you can combine drawCircle() and lineTo() to quickly draw a clock/dial primitive shape. I’ll use this in tomorrows snippet…

Read snippet: lineTo() w/ drawCircle()

Circles & cacheAsBitmap

[SWF(width=600,height=400,backgroundColor=0x000000,frameRate=30)]
var mcs:Vector.<MovieClip> = new Vector.<MovieClip>();
var num:int = 2000;
for (var i:int = 0; i<num; i++){
	var s:MovieClip = new MovieClip();
	s.graphics.lineStyle(0,0xFFFFFF);
	s.graphics.drawCircle(0,0, Math.random()*30 + 3);
	s.x = Math.random()*stage.stageWidth;
	s.y = Math.random()*stage.stageHeight;
       // comment out to kill your cpu
	s.cacheAsBitmap = true;
	addChild(s);
	s.vx  = Math.random() * 2 - 1;
	s.vy  = Math.random() * 2 - 1;
    mcs.push(s);
}
addEventListener(Event.ENTER_FRAME, onCenter);
function onCenter(evt:Event):void{
	for (var i:int = 0; i<num; i++){
		mcs[i].x += mcs[i].vx;
		mcs[i].y += mcs[i].vy;
	}
}

This was created in response to a question about the real speed gain of cacheAsBitmap. Just comment out the cacheAsBitmap line to see the difference.

Despite it’s extreme simplicity, this is actually a rather fun file to play with, change some of the graphics class method calls around and see what happens.

Read snippet: Circles & cacheAsBitmap

Graphics Class Methods in XML

// for simplicity I left this XML inline, this will work exactly the same if it were external
var program:XML=<body>
				<draw>
				  <![CDATA[
				   beginFill(0xFF0000);
				   drawCircle(100,100,50);
				   endFill();
				   lineStyle(0, 0x666666);
				   moveTo(100, 100);
				   lineTo(200, 200);
				   moveTo(300, 200);
				   curveTo(350, 300, 400, 200);
				   lineStyle(0, 0x0000FF);
				   drawRect(200, 50,100,100) ;
					]]>
				</draw>
</body>;

// parse and run the Graphics class commands from the XML
render(parseFunctions(program.draw.toString()));

function parseFunctions(dat:String):Array{
	var a:Array = dat.split(";") ;
	for (var i:int = 0; i<a.length-1; i++){
		a[i] = a[i].split(/()|(|)/g);
		var f:String = a[i][0] = a[i][0].replace(/s/g,"");
		a[i] = a[i].splice(0, a[i].length - 1);
		if (a[i].length> 1){
		 a[i] = a[i][1].split(",");
		 a[i].unshift(f);
		}
	}
	return a.splice(0,a.length - 1);
}
function render(p:Array):void {
	for (var i:int = 0; i<p.length; i++) {
		graphics[p[i][0]].apply(graphics,p[i].splice(1));
	}
}

The above code builds on yesterdays post by showing how one could potentially store graphics class method calls in XML using a few regular expressions and Function.apply().

The parseFunctions() function reads through the CDATA string and formats it in a 2D array that looks like this:

[[beginFill, 0xFF0000], [drawCircle, 100, 100, 50], etc...]

The render() function reads through this 2D array, using the first value of each nested array as the function and the remaining values as arguments…

As is this won’t really work with most of the new fp10 graphics methods…

Read snippet: Graphics Class Methods in XML

Dynamic Graphics and Function.apply()

var cmds:Array = [["lineStyle", 0, 0xFF0000], ["drawCircle",100, 100, 50], ["drawRect", 50, 50, 100, 100]];
cmds.push(["drawCircle", 100, 100, 70]);
cmds.push(["beginFill",  0x555555]);
cmds.push(["drawRoundRect", 80, 80, 40, 40, 10, 10]);
cmds.push(["endFill"]);

render(cmds);

function render(p:Array):void {
	for (var i:int = 0; i<p.length; i++) {
		graphics[p[i][0]].apply(graphics,p[i].splice(1));
	}
}

The above creates a function called render() that takes a 2D array of Graphics class methods and then runs them. This is a very interesting technique, specifically if you’d like to write Graphics class method calls in an XML or txt file and then have them run on a given DisplayObject in flash.

I’ve been thinking about the best way to do this for awhile… I started off doing something very convoluted and then realized that I could use Function.apply()….

Tomorrow I’ll post a snippet showing how to use this function in conjunction with XML.

Read snippet: Dynamic Graphics and Function.apply()

Animate Along Bezier Curve

var circle:Shape = Shape(addChild(new Shape));
with(circle.graphics) beginFill(0x000000), drawCircle(0,0,5);
 
var bezierPoint:Point = new Point();
function bezier(a:Number, x1:Number, y1:Number, x2:Number, y2:Number, x3:Number, y3:Number):void {
		var b:Number =1-a;
		var pre1:Number=a*a;
		var pre2:Number=2*a*b;
		var pre3:Number=b*b;
		bezierPoint.x = pre1*x1 + pre2*x2  + pre3*x3;
	    bezierPoint.y = pre1*y1 + pre2*y2 + pre3*y3;
}

var inc:Number = 0;
var theta:Number = 0;

addEventListener(Event.ENTER_FRAME, onLoop);
function onLoop(evt:Event):void {
	
	 graphics.clear();
	 graphics.lineStyle(0,0xFF0000);
     graphics.moveTo(200,200);
     graphics.curveTo(mouseX, mouseY, 400, 200);

	theta+= .05;
	inc = .5 + .5*Math.sin(theta);
 
	bezier(inc, 200, 200, mouseX, mouseY, 400, 200);
	circle.x = bezierPoint.x;
	circle.y = bezierPoint.y;
}

The above animates a circle along a quadratic bezier curve. This snippet was written in response to a question spurned by some of the recent bezier posts. I used Math.sin() to animate the circle but you could just as easily use modulus… simply replace lines 25-26 with the following:

inc += .03;
inc %= 1;
Read snippet: Animate Along Bezier Curve

Bezier Skin (smooth curveTo())

// graphics, vector of xy coords, closed boolean
function bezierSkin(g:Graphics, bez:Vector.<Number>, closed:Boolean = true):void {
	var avg:Vector.<Number> = calcAvgs(bez);
	var i:int, n:int;
	var leng:int = bez.length;

	if (closed){
		g.moveTo(avg[0], avg[1]);
		for (i = 2; i < leng; i+=2) {
			n=i+1;
			g.curveTo(bez[i], bez[n], avg[i], avg[n]);
		}
		g.curveTo(bez[0], bez[1], avg[0], avg[1]);
	}else{
		g.moveTo(bez[0], bez[1]);
	    g.lineTo(avg[0], avg[1]);
		for (i = 2; i < leng-2; i+=2) {
			n=i+1;
			g.curveTo(bez[i], bez[n], avg[i], avg[n]);
		}
		g.lineTo(bez[ leng - 2], bez[ leng - 1]);
	}
}

// create anchor points by averaging the control points
function calcAvgs(v:Vector.<Number>):Vector.<Number> {
	var avg:Vector.<Number> = new Vector.<Number>();
	var leng:int=v.length;
	for (var i:int = 2; i<leng; i+=1) {
		var prev:Number=i-2;
		avg.push( (v[prev] + v[i]) / 2 );
	}
	// close
	avg.push( (v[0] + v[ leng - 2]) / 2 );
	avg.push( (v[1] + v[ leng - 1]) / 2 );
	return avg;
}

// test out the functions:

graphics.lineStyle(0,0x000000);

// draw a very rounded rect
bezierSkin(graphics, Vector.<Number>([100,100,200,100,200,200,100,200]) );

// draw a random curve with 10 xy coords
var rnd:Vector.<Number> = new Vector.<Number>();
for (var i:int = 0; i<20; i++) rnd.push(Math.random()*100);
bezierSkin(graphics, rnd);
						
// erase everything and allow the used to draw a smooth curve with the mouse
stage.addEventListener(MouseEvent.MOUSE_DOWN, onLoop);
var index:int = 0;
var pnts:Vector.<Number> = new Vector.<Number>();

function onLoop(evt:MouseEvent):void {
	 pnts.push(mouseX);
	 pnts.push(mouseY);
	
     graphics.clear();
	 graphics.lineStyle(0,0x000000);
	 
	  // draw a smooth curved line
	 bezierSkin(graphics,pnts,false);
}

The above code uses averaging to generate anchor points for curveTo() calls. This is an easy way to always draw smooth curves.

This is an old one that I’ve seen floating around since the drawing api first came out… but I it’s an important snippet, so I figured I’d post it.

Read snippet: Bezier Skin (smooth curveTo())